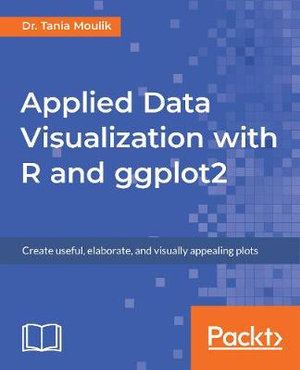
Applied Data Visualization with R and ggplot2
Create useful, elaborate, and visually appealing plots
By: Dr. Tania Moulik
Paperback | 27 September 2018
At a Glance
Paperback
$67.68
Aims to ship in 7 to 10 business days
When will this arrive by?
Enter delivery postcode to estimate
Develop informative and aesthetic visualizations that enable effective data analysis in less time
Key Features- Discover structure of ggplot2, grammar of graphics, and geometric objects
- Study how to design and implement visualization from scratch
- Explore the advantages of using advanced plots
Applied Data Visualization with R and ggplot2 introduces you to the world of data visualization by taking you through the basic features of ggplot2. To start with, you'll learn how to set up the R environment, followed by getting insights into the grammar of graphics and geometric objects before you explore the plotting techniques.
You'll discover what layers, scales, coordinates, and themes are, and study how you can use them to transform your data into aesthetical graphs. Once you've grasped the basics, you'll move on to studying simple plots such as histograms and advanced plots such as superimposing and density plots. You'll also get to grips with plotting trends, correlations, and statistical summaries.
By the end of this book, you'll have created data visualizations that will impress your clients.
What you will learn- Set up the R environment, RStudio, and understand structure of ggplot2
- Distinguish variables and use best practices to visualize them
- Change visualization defaults to reveal more information about data
- Implement the grammar of graphics in ggplot2 such as scales and faceting
- Build complex and aesthetic visualizations with ggplot2 analysis methods
- Logically and systematically explore complex relationships
- Compare variables in a single visual, with advanced plotting methods
Applied Data Visualization with R and ggplot2 is for you if you are a professional working with data and R. This book is also for students who want to enhance their data analysis skills by adding informative and professional visualizations. It is assumed that you know basics of the R language and its commands and objects.
ISBN: 9781789612158
ISBN-10: 1789612152
Published: 27th September 2018
Format: Paperback
Language: English
Number of Pages: 140
Audience: Professional and Scholarly
Publisher: Packt Publishing
Country of Publication: GB
Dimensions (cm): 23.5 x 19.05 x 0.76
Weight (kg): 0.26
Shipping
| Standard Shipping | Express Shipping | |
|---|---|---|
| Metro postcodes: | $9.99 | $14.95 |
| Regional postcodes: | $9.99 | $14.95 |
| Rural postcodes: | $9.99 | $14.95 |
How to return your order
At Booktopia, we offer hassle-free returns in accordance with our returns policy. If you wish to return an item, please get in touch with Booktopia Customer Care.
Additional postage charges may be applicable.
Defective items
If there is a problem with any of the items received for your order then the Booktopia Customer Care team is ready to assist you.
For more info please visit our Help Centre.
You Can Find This Book In
This product is categorised by
- Non-FictionComputing & I.T.Graphical & Digital Media Applications3D Graphics & Modelling
- Non-FictionComputing & I.T.Computer ScienceHuman-Computer InteractionInformation Visualisation
- Non-FictionComputing & I.T.Computer ScienceHuman-Computer InteractionInformation Architecture
- Non-FictionComputing & I.T.DatabasesDatabase Design & Theory
